
$ \begin{eqnarray*} v_0 &=& \frac{v_{max}[S]}{k_m + [S]} \\ \frac{1}{v_0} &=& \frac{k_m + [S]}{v_{max}[S]} \\ \frac{1}{v_0} &=& \frac{k_m}{v_{max}[S]} + \frac{[S]}{v_{max}[S]} \\ \frac{1}{v_0} &=& \left(\frac{k_m}{v_{max}}\right)\left(\frac{1}{[S]}\right) + \frac{1}{v_{max}} \\ \end{eqnarray*} $
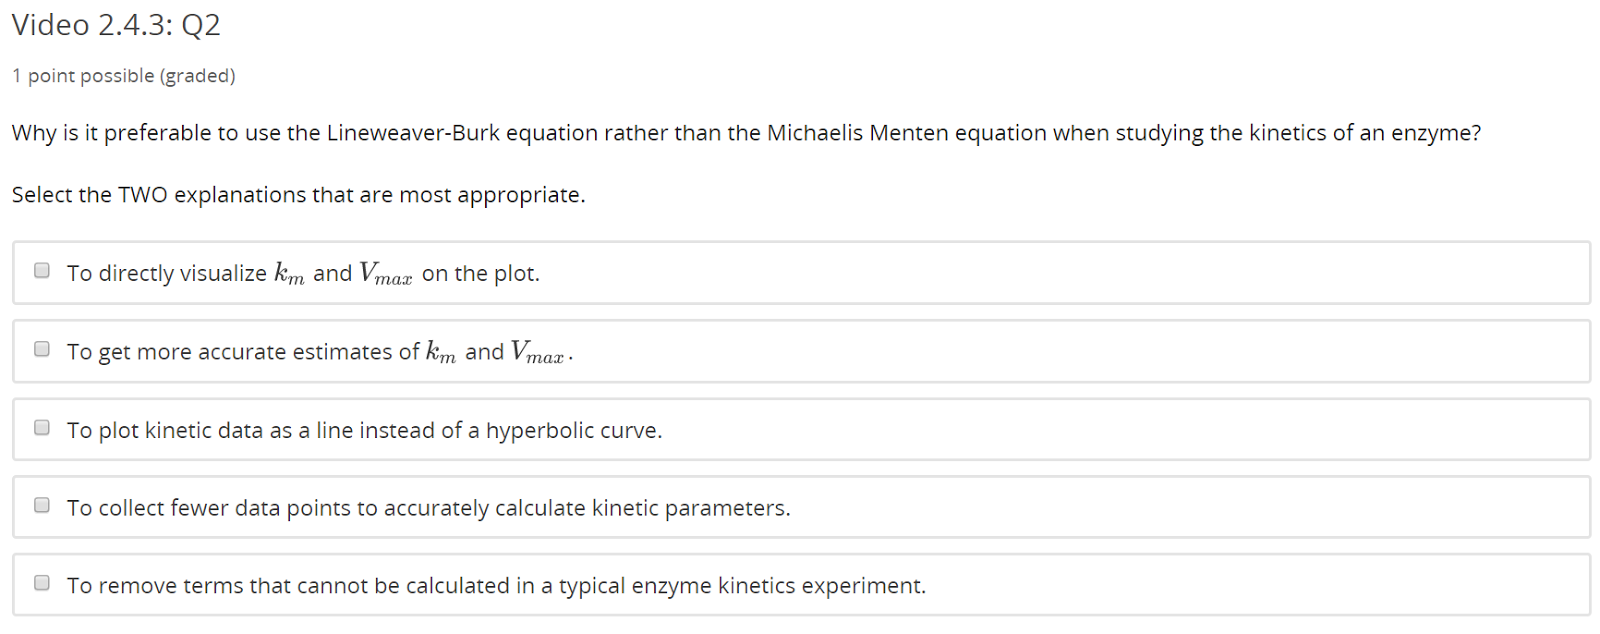
It is easier to fit a line than to fit a hyperbola. This plot allow us to get more accurate estimate of $ k_m $ and $ V_{max} $, and also to plot kinetic data as a line instead of a hyperbolic curve.
Note that while we can visualize $ \frac{1}{V_{max}} $ and $ \frac{1}{k_m} $ on the line, it is not counted as "directly" visualize $ V_{max} $ and $ k_m $, therefore the first option is not correct.
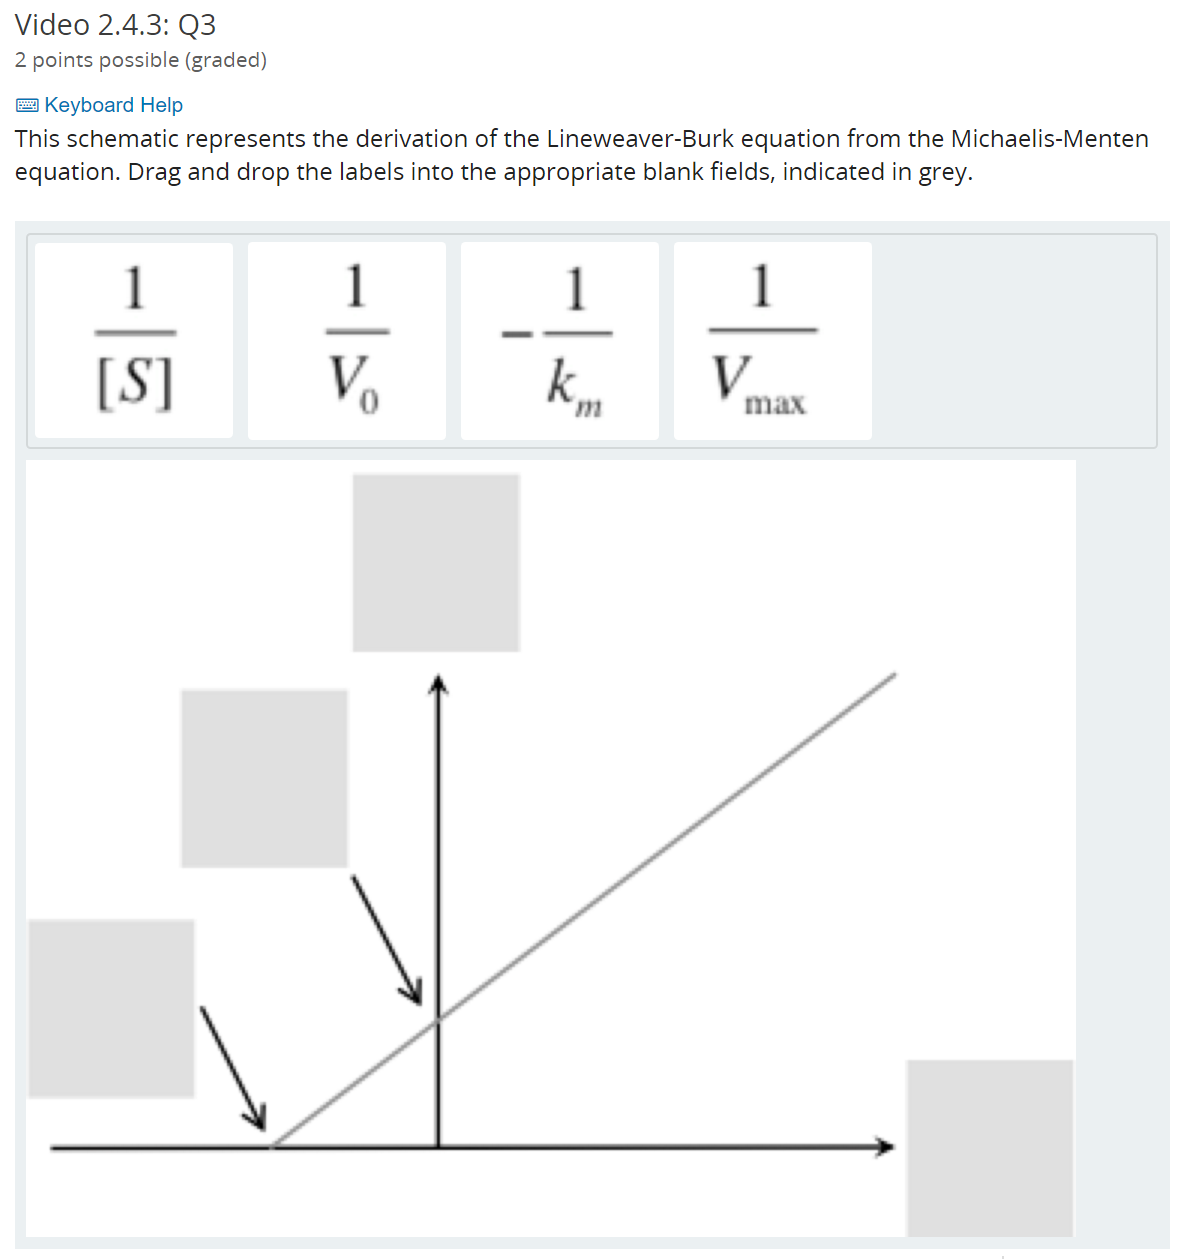
The x axis is $ \frac{1}{[S]} $
The y axis is $ \frac{1}{V_0} $
The y-intercept is $ \frac{1}{V_{max}} $
The x-intercept is $ -\frac{1}{K_m} $

$ V_{max} = \frac{1}{3 \times 10^7} = 3.33 \times 10^{-8} = 33.33 \times 10^{-9} \frac{mol}{L min} $.
$ V_{max} = \frac{1}{5 \times 10^4} = 2 \times 10^{-5} = 20 \times 10^{-6} \frac{mol}{L} $.
No comments:
Post a Comment